
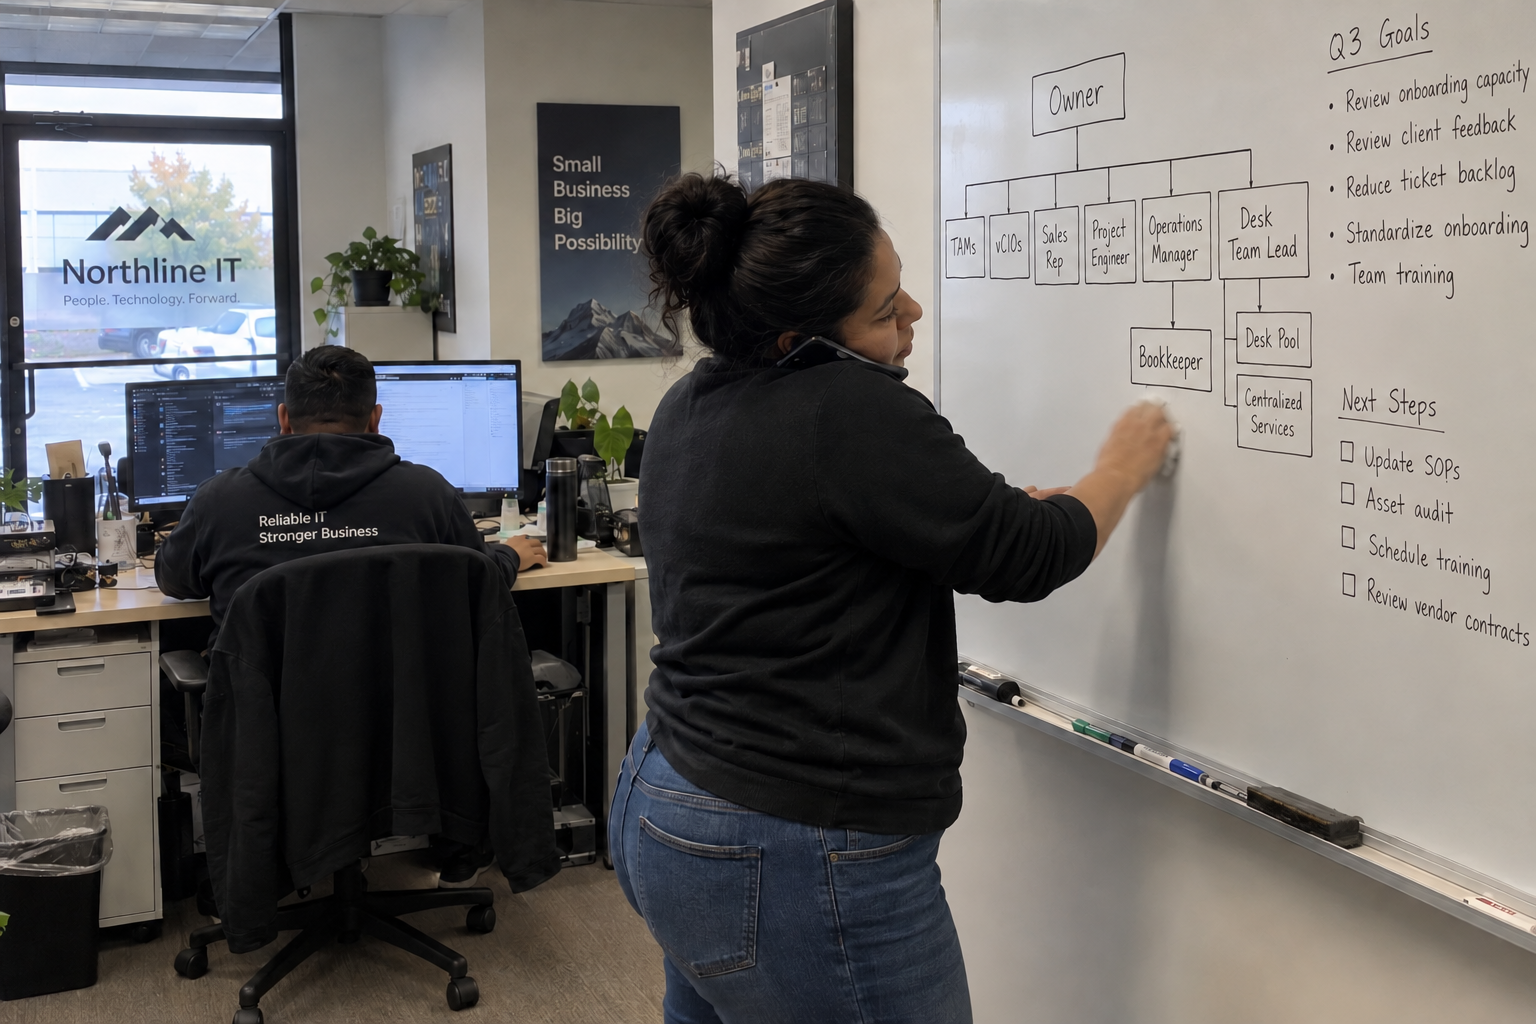
At 700 seats across 35 clients, the MSP model's stable US example allocates 12.50 full-time equivalents, including the owner. An MSP org chart for that example needs to name who carries the fractional work as well as who reports to whom. A box with no person assigned is still a vacancy in the plan.
A full-time equivalent, or FTE, measures a full-time amount of work. It doesn't mean the business can recruit part of a person for every box. I'd start with the model's role allocations, then check whether the proposed people have the hours to cover them.
Put the Work and the Reporting Lines Together
The table keeps the model's workload and role allocations. Its technical alignment manager and virtual chief information officer report to the owner under the model's structure. The other reporting lines below are my proposed arrangement, to check against your own business.
| Role | Stable Model FTE | Responsibility | Proposed Reporting Line |
|---|---|---|---|
| Pooled support technicians | 4.00 | The pool handles ticket and residual alert work. | The technicians report to a team lead chosen from the pool. |
| Technical alignment managers, or TAMs | 2.25 | The TAMs own client standards and technical-environment alignment. | The TAMs report to the owner, as the model specifies. |
| Virtual chief information officers, or vCIOs | 1.13 | The vCIOs own the business conversation and budget. | The vCIOs report to the owner, as the model specifies. |
| Centralized services | 0.14 | The role carries the retained centralized administration workload. | The assigned person reports to the team lead for this work. |
| Project engineering | 1.48 | Project engineers deliver billed projects and unpaid onboarding. | The project engineer reports to the owner. |
| Sales representative | 1.00 | The representative owns new-business sales. | The sales representative reports to the owner. |
| Operations and office management | 1.00 | The manager owns HR, purchasing, vendor, and billing administration. | The operations manager reports to the owner. |
| Bookkeeping | 0.50 | The bookkeeper maintains the books with the outside accountant. | The bookkeeper reports to the operations manager. |
| Owner | 1.00 | The owner carries leadership and the owner-assigned responsibilities. | The owner reviews the whole allocation. |
Those allocations total 12.50 FTE, using the model's underlying figures. The growth setting adds marketing capacity and project-engineer time for extra onboarding, taking the example to 13.75 FTE. The chart describes those assumptions; it isn't a staffing ratio to apply to every MSP with the same revenue.
Keep the Desk Calculation Behind the Four Boxes
The desk allocation starts with workload. The model's 700 seats at its well-run assumption of 0.5 tickets per seat a month produce 700 × 0.5 = 350 tickets. Its resolving-tier mix gives 65% × 30 + 22% × 60 + 13% × 120 = 48.30 labor minutes per ticket.
Ticket labor is 350 × 48.30 / 60 = 281.75 hours a month. With an endpoint per seat and 0.04 residual alert hours per endpoint per month, alerts add 700 × 0.04 = 28 hours. Total monthly desk work is 281.75 + 28 = 309.75 hours, or about 309.8.
The model supplies 1,660 available hours a year at 70% service utilization: 1,660 × 70% / 12 = about 96.83 productive hours per technician per month. The desk workload is 309.75 / (1,660 × 70% / 12) = about 3.20 FTE. The model staffs the pool as four whole people. It gives a typical MSP a ticket rate of 1.0 to 1.4 per seat per month, so use your measured work before adopting the well-run allocation.
The model uses a team lead to dispatch for the small pool. Its service-manager or working-lead point is about eight desk people, and its dedicated-dispatcher point is about ten. Keep those model rules visible without treating them as proof of what your own team needs.
Give Each Fraction a Named Decision Owner
Here are the allocation choices I'd put in front of the owner and service lead. Each proposed arrangement needs a capacity check before it becomes a person's assignment. The fraction in the spreadsheet doesn't reserve the hours.
| Work to Place | Who Owns the Allocation | Arrangement to Check |
|---|---|---|
| Centralized services require 0.14 FTE. | The owner and service lead approve this allocation. | A desk technician may carry this work if the corresponding hours fit alongside the assigned desk workload. |
| Project engineering requires 1.48 FTE. | The owner and project lead approve this allocation. | One full-time engineer leaves 0.48 FTE to place with another named person or a contractor arrangement. |
| TAM work requires 2.25 FTE. | The owner approves the account-work allocation. | Two full-time TAMs leave 0.25 FTE to assign; the owner checks the proposed recipient’s actual available hours. |
| vCIO work requires 1.13 FTE. | The owner approves the business-advisory allocation. | One full-time vCIO leaves about 0.13 FTE to place with the owner or another named person. |
| Bookkeeping requires 0.50 FTE. | The owner and operations manager approve this allocation. | A half-time bookkeeping arrangement covers the modeled role; the operations manager confirms its scope. |
Check shared assignments in hours before adding the fractions. The model uses 70% utilization for service staff and 85% for dedicated project engineers. A project fraction and a desk fraction therefore aren't interchangeable amounts of productive time.
The modeled desk has about 0.80 FTE of slack between its workload and four-person staffing. If you propose using that capacity for another role, subtract the actual hours once and check what remains. Don't keep the full desk capacity in one worksheet and promise the same hours to projects in another.
Keep the Account Roles Distinct
The model staffs TAM work at about $70,000 of monthly recurring revenue per FTE and vCIO work at about $140,000. Monthly recurring revenue, or MRR, is the recurring monthly fee total on that basis. The example's $157,500 MRR gives $157,500 ÷ $70,000 = 2.25 TAM FTE and $157,500 ÷ $140,000 = about 1.13 vCIO FTE.
Those are revenue-based allocations, not measurements of a particular person's spare hours. Before assigning the remaining TAM work to a vCIO, check that person's real commitments. Keep new-business sales separate from account management, as the model requires.
For the owner, the draft arrangement means supervising the account team and the other direct reports while carrying any work explicitly assigned back to you. Count that work before approving the chart. Pay the owner a fair-market salary before counting profit, and classify the owner's actual ticket work as direct delivery labor.
Check the Roles the Model Leaves Out
The small example doesn't add every specialist title. These are its structural choices to review, rather than evidence that your own workload needs no specialist:
- The service lead handles dispatch through the team lead until the modeled dedicated-dispatcher point.
- The owner checks the management workload before adding a separate manager role.
- The service lead checks retained alert work and skills against the model’s RMM automation and desk arrangement, rather than assuming a separate network operations center engineer.
Onboarding belongs with project engineers in the model, at 60 hours per new client. Keep those commitments in the project schedule. If you also propose using the engineer for escalation cover, identify which work moves and who accepts it.
Test the Chart Against Monday’s Board
My test is: what does this do to the board on Monday morning? The answer should be a named owner for each commitment and a reporting line for resolving a clash. An extra rectangle has never answered a ticket.
- The owner lists the people available and the roles each person is expected to carry.
- The service lead checks desk and centralized hours against those assignments.
- The project lead places project and onboarding work into the same capacity plan.
- The owner assigns the account-role remainders and checks personal delivery commitments.
- The operations manager records the agreed reporting lines and flags any work without an owner.
Use the chart to expose an unresolved allocation before it becomes a promise to a client. Where work doesn't fit, change the assignment or the plan. Keep the unplaced hours visible until somebody has both the responsibility and the capacity to take them.

mspoutpost.com/articles/msp-org-chart-assign-the-roles-behind-the-headcount
Written by Megan Friesen
MSP Outpost publishes information, not legal, financial, insurance, tax or compliance advice, and reading it creates no professional relationship. For decisions about your business, talk to a qualified professional.