
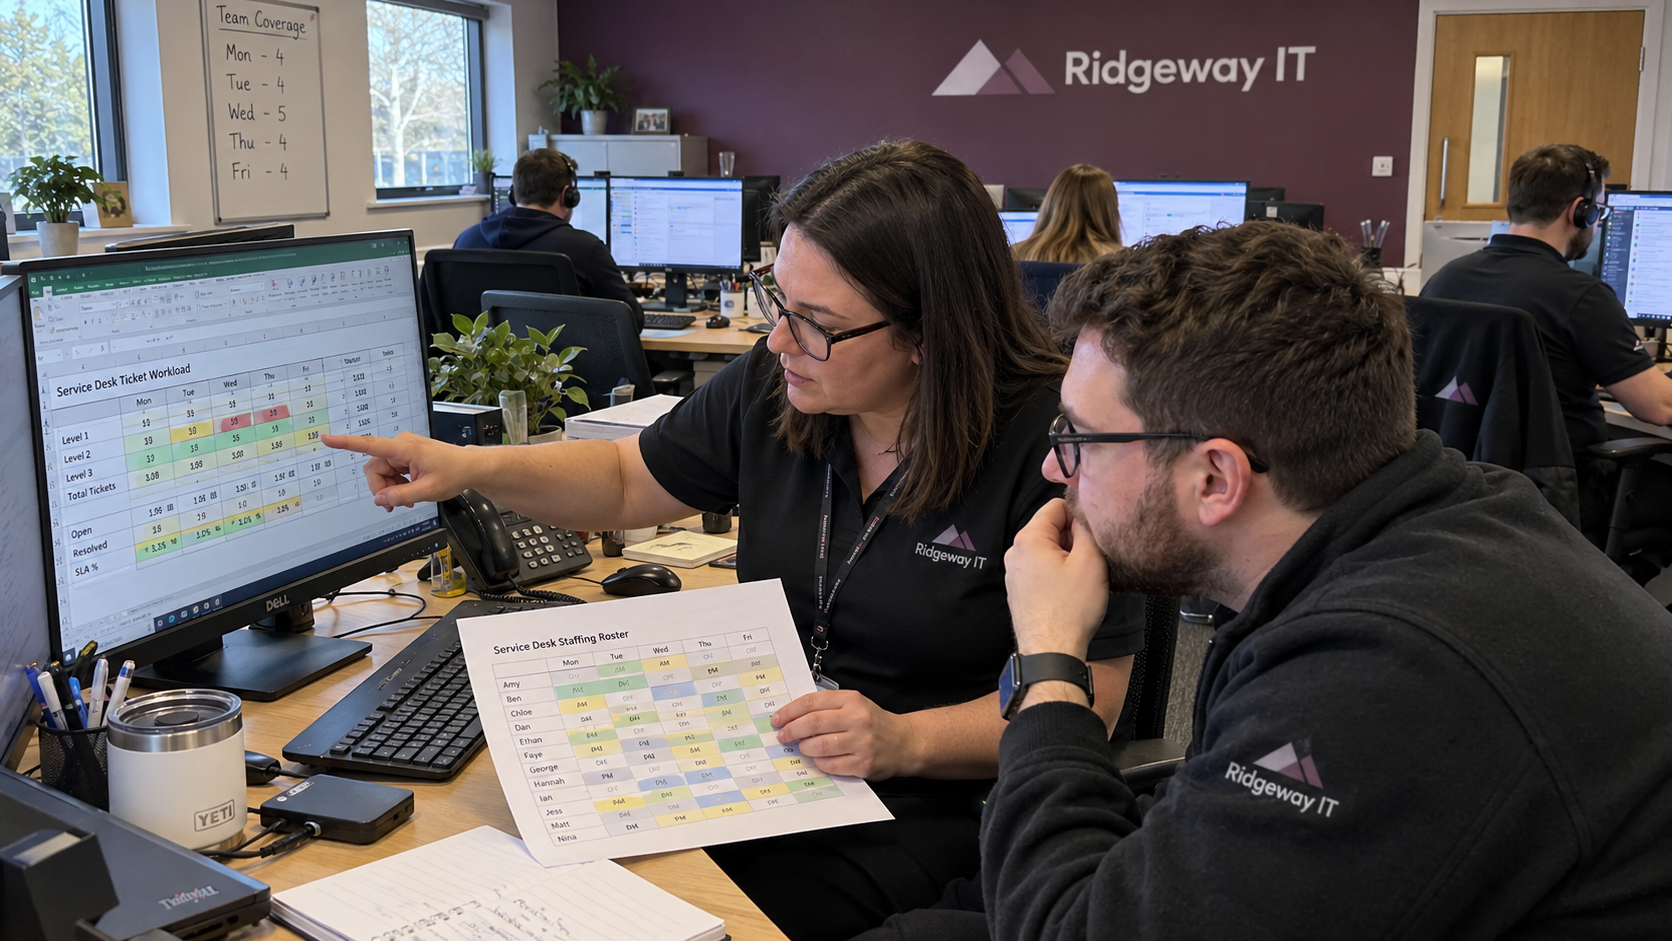
Service desk staffing changes from four technicians to seven in the model's 700-seat example when demand rises from 0.5 to 1.0 tickets per seat a month. The 0.5 input describes a well-run MSP; a typical MSP runs 1.0 to 1.4. Measure the work arriving at your desk before you decide how many people to put on it.
I'd calculate the labor first, then check whether the people available can cover it. A seats-per-tech ratio can describe the result. It can't tell you the ticket demand or the skills needed to produce it.
Measure Demand Before Choosing an Assumption
Use the same reporting period for your ticket workload and managed-seat count. Divide tickets by seats and by the months covered to get tickets per seat per month. Check the export's inclusion rules so a change in what you count doesn't masquerade as a change in demand.
If you haven't measured your desk, don't start it at the well-run 0.5 rate. Compare the model's typical range of 1.0 to 1.4 while you gather your own figures, and make the uncertainty visible in the hiring decision. The lower rate belongs in a clearly labeled example, not an optimistic default.
| Input | What You Need | Who Checks It |
|---|---|---|
| Ticket Demand | Monthly tickets and the seats supported during the same period | The service lead checks the PSA export and seat records |
| Labor per Ticket | Recorded labor for tickets resolved at each tier, including escalation work | The service lead checks time entries with the technicians |
| Residual Alerts | Human work left after RMM automation, kept separate from ticket labor already counted | The monitoring owner checks how alert work is recorded |
| Productive Capacity | Available hours and the share that can actually go to service work | The manager checks leave, internal work, and coverage |
Keep labor minutes separate from elapsed resolution time. A ticket waiting for a client isn't the same as a technician working on it. If several technicians contribute, count their labor once each and check that your tier grouping hasn't dropped the earlier work.
Work Through the Well-run Example
Say you run the model's 700-seat US example at its well-run rate of 0.5 tickets per seat per month. That gives 700 × 0.5 = 350 tickets a month. Use the model's resolution mix and labor assumptions to convert those tickets into hours.
| Resolving Tier | Share of Tickets | Labor Minutes per Ticket |
|---|---|---|
| Tier 1 | 65% | 30 |
| Tier 2 | 22% | 60 |
| Tier 3 | 13% | 120 |
The weighted average is 65% × 30 + 22% × 60 + 13% × 120 = 48.30 labor minutes per ticket. Monthly ticket labor is 350 × 48.30 / 60 = 281.75 hours, or about 281.8. These are calibrated model assumptions; replace the mix and labor times with measurements from your desk.
The example also has 700 endpoints and 0.04 hours of residual alert work per endpoint per month. Residual alerts add 700 × 0.04 = 28.0 hours a month. Total monthly desk work is 281.75 + 28.0 = 309.75 hours, or about 309.8 before staffing. Don't add those alert hours again if your ticket labor already includes them.
The model starts with 1,660 available hours per technician per year and applies 70% service utilization. Productive capacity is 1,660 × 70% / 12 = about 96.83 hours per technician per month. The utilization allowance keeps the calculation from treating every available hour as ticket capacity.
The example needs 309.75 / (1,660 × 70% / 12) = about 3.20 full-time equivalents, or FTE. That describes the work in full-time roles. The model rounds up to four technicians, with a minimum desk of two.
Payroll remains stubbornly attached to whole people.
Check What the Rounded Headcount Can Cover
| Capacity Line | Well-Run Example |
|---|---|
| Monthly Workload | About 309.8 hours |
| Productive Capacity per Technician | About 96.83 hours a month |
| Workload in Full-Time Roles | About 3.20 FTE |
| Staffed Technicians | 4 |
| Staffed Productive Capacity | 4 × (1,660 × 70% / 12) = about 387.3 hours a month |
| Headroom Using Unrounded Inputs | 4 × (1,660 × 70% / 12) − 309.75 = about 77.6 hours; (4 × (1,660 × 70% / 12) − 309.75) / (1,660 × 70% / 12) = about 0.80 FTE |
That headroom is spread across people and working hours. It isn't a separate technician you can assign to anything. Check who can handle the escalations and who is present when the work arrives before you commit that capacity elsewhere.
The model's ticket mix makes that skills check worth doing: Tier 3 resolves 13% of tickets but accounts for about 32% of ticket labor. A quiet general queue doesn't prove that the person handling those escalations has room. Compare the allocation of hours with the people who can do the work.
The minimum of two is a model planning choice for cover, not proof that every two-person rota covers every absence. Check the actual leave arrangement and the work the remaining person can accept. The staffing total still needs a usable roster.
Run the Same Seats at Higher Demand
Hold the resolution mix, labor minutes, and residual alert work fixed, then change the example to 1.0 tickets per seat per month, within the stated typical range. The example now produces 700 × 1.0 = 700 tickets a month. Ticket labor is 700 × 48.30 / 60 = 563.5 hours; total desk work is 563.5 + 28.0 = 591.5 hours a month.
The workload is 591.5 / (1,660 × 70% / 12) = about 6.11 FTE, rounded up to seven technicians. That is why I wouldn't approve a hire from a seats-per-tech ratio. The seat count stayed put while the work changed.
Before adding a salary, check whether repeat faults or departures from your standard stack explain some of the demand. Correct work you can remove and rerun the calculation with measured results. Don't count hoped-for automation savings as hours already available.
Plan the Roles Around the Desk
The model has a team lead dispatching from the pool below its dedicated-role thresholds. It places a service manager or working lead at about eight desk people, a dedicated dispatcher at about ten, and a split into pods or tiers at twelve to fifteen. Those are planning points to compare with your workload, not instructions to wait while an uncovered management job grows.
Keep that work visible when you assign a team lead. If dispatch or coaching takes time from tickets, check where you've allowed for it before treating all the lead's capacity as available to the queue. Likewise, don't quietly put new-client onboarding on this desk calculation: the model assigns that work to project engineers.
When the example reaches its next whole pool technician, the model budgets about $80,326 annually at the blended US wage and burden. Put the cost beside the demand forecast and the recruiting lead time you can actually support. There is no model threshold that tells you to wait until every hour is committed.
Give Each Check an Owner
I don't buy a growth hack that skips the time entries. My test for the resulting plan is simple: what does this do to the board on Monday morning? I want the service lead to be able to assign the expected work to people who are available and able to do it.
- The service lead confirms the ticket and seat counts cover the same period and records any missing work.
- The service lead and technicians check the labor mix, including time spent before escalation.
- The monitoring owner confirms the alert allowance includes only work not counted in the ticket total.
- The manager checks productive hours against the leave plan and the duties assigned outside ticket work.
- The owner approves the proposed headcount, its cost, and any unresolved coverage gap before a job is offered.
Keep the calculation with that decision and name which assumptions still need measurement. Review it when demand or coverage changes, and before approving the next hire. If the queue and the calculation disagree, inspect the missing hours before deciding which one to believe.

mspoutpost.com/articles/service-desk-staffing-turn-ticket-work-into-headcount
Written by Megan Friesen
MSP Outpost publishes information, not legal, financial, insurance, tax or compliance advice, and reading it creates no professional relationship. For decisions about your business, talk to a qualified professional.