
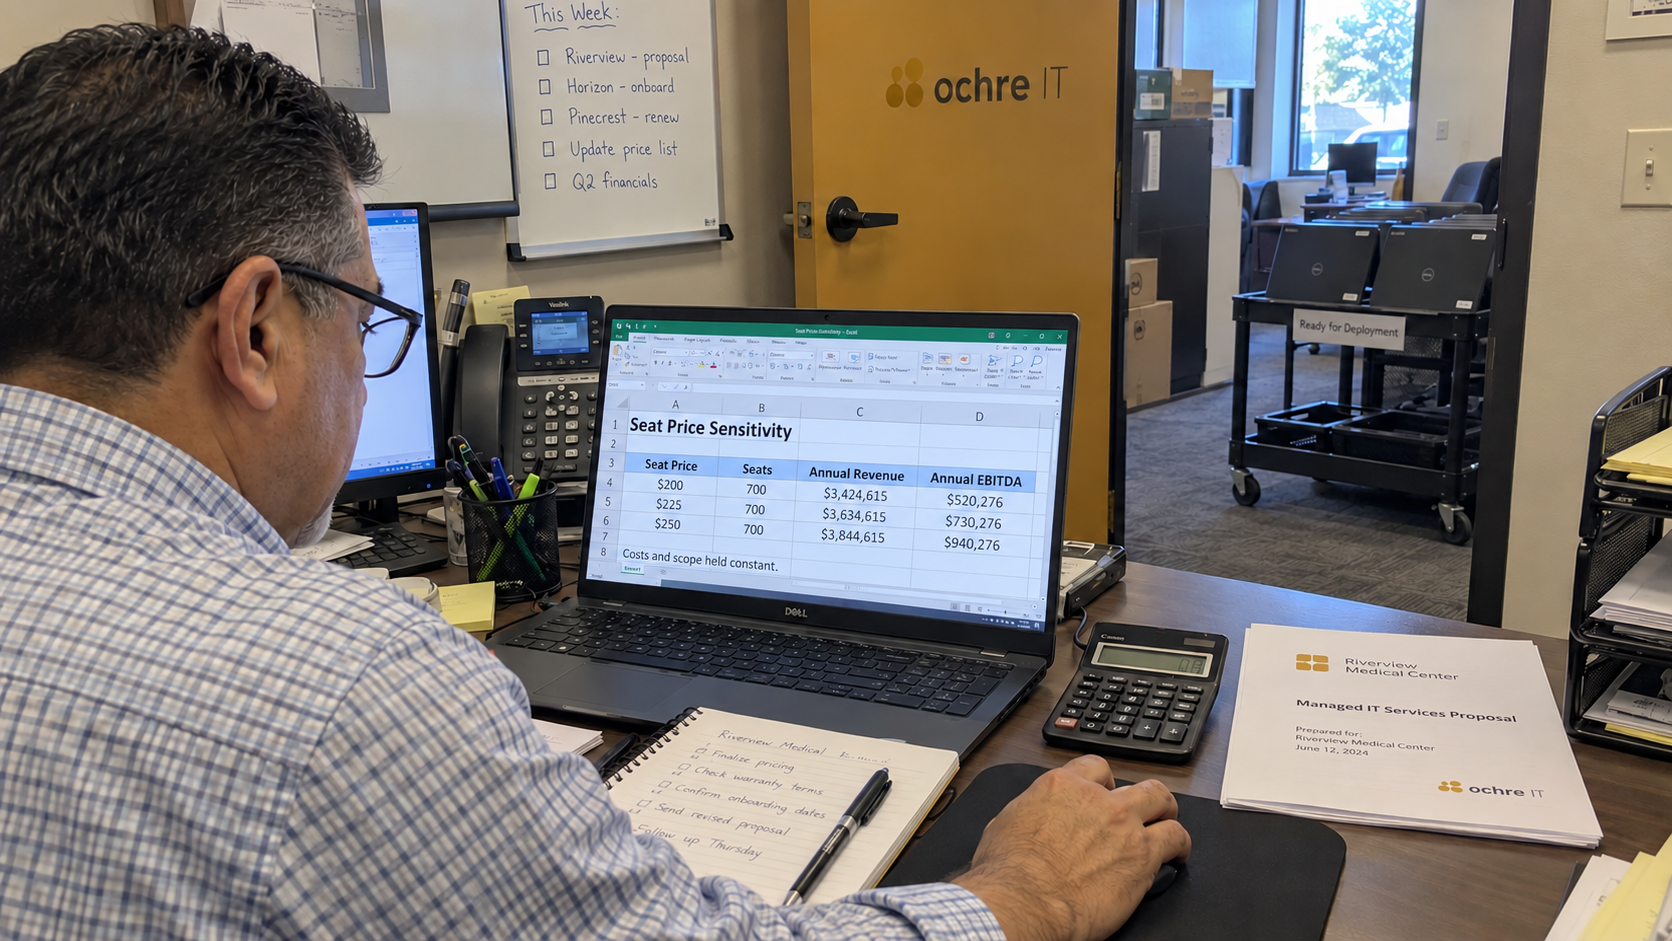
Before changing your MSP price per user, calculate the annual revenue difference and carry it through the whole profit calculation. Hold seats, scope, and costs constant for the first comparison. Then show what would change in the real proposal, including service work, client departures, and the date the new price starts.
Say you run the US MSP model's 700-seat example at its $225 monthly seat fee. A $25 change applied to every seat for a full year changes revenue by $210,000: 700 multiplied by $25 multiplied by 12. Under fixed costs, the same amount changes EBITDA, which is earnings before interest, taxes, depreciation, and amortization.
Name the Price You Are Changing
Use the managed-services seat fee for this calculation. Keep resold licenses and other recurring product separate, along with hardware and projects. A change to product pricing has its own supplier cost and margin, so folding it into the seat-fee change would obscure the result.
The model counts a seat as the larger of users or devices. If your agreement uses a different definition, write that definition beside the calculation and use the count actually billed. A per-user comparison needs the same unit in every row.
For a single prospect, calculate the effect on that prospect's seats. For a book-wide scenario, use the seats whose prices could actually change. The 700-seat example applies the change to the whole modeled book; it isn't the cost of giving one new client a concession.
Build the Fixed-Cost Comparison First
The model's baseline has $3,634,615 in total annual revenue and $730,276 in bottom-up EBITDA, about 20.1%. It includes the named delivery roles, tools, overhead, and fair-market owner salary. Use those costs as fixed amounts in this first sensitivity, with non-seat revenue also unchanged.
For the requested price test, subtract and add $25 to the model's $225 starting fee. That produces $200 and $250 as calculated test prices. They are scenario inputs, not additional pricing benchmarks or recommendations.
| Monthly Seat Fee | Annual Revenue Change | Total Annual Revenue | Annual EBITDA | EBITDA Margin |
|---|---|---|---|---|
| $200, Calculated Lower Test | Minus $210,000 | $3,424,615 | $520,276 | About 15.2% |
| $225, Model Baseline | No Change | $3,634,615 | $730,276 | About 20.1% |
| $250, Calculated Higher Test | Plus $210,000 | $3,844,615 | $940,276 | About 24.5% |
The lower row uses $3,634,615 minus $210,000 for revenue and $730,276 minus $210,000 for EBITDA. Its margin is $520,276 divided by $3,424,615. Calculate the higher row by adding the same revenue increment to the same baseline figures.
Notice the denominator. EBITDA margin is EBITDA divided by that row's total revenue. Don't divide every result by baseline revenue, and don't subtract the price-change percentage from the original margin. Neither gives the margin of the revised business.
Keep Delivery Margin Separate From EBITDA
Managed-services gross margin subtracts burdened delivery labor and tools from the managed fee. EBITDA also reflects sales spending and overhead. A price that produces a positive delivery margin can still leave too little profit for the whole business.
The model's direct managed-services cost is $103.10 per seat per month, rounded. At its $225 baseline fee, the implied managed-services margin is about 54.2%. That figure isn't the 20.1% whole-business EBITDA margin.
The model's published lower-price comparison illustrates the gap. At $175, holding headcount and non-seat revenue constant, it shows about 41.1% managed-services margin and $310,276 in EBITDA, or 9.7%. At the $150 floor, it shows 31.3% managed-services margin and $100,276 in EBITDA, or 3.3%.
The floor is a danger line, not a target price or a universal break-even point. The model aims for 20% EBITDA after fair-market owner pay and treats 10% as a danger line. Your actual cost structure decides what remains at a given fee.
Show What You Held Constant
Put the assumptions immediately above the table. I'd include the affected seat count, start date, billing unit, service scope, direct delivery cost, non-seat revenue, and other spending. A reader should be able to identify exactly what moved between rows.
The fixed-cost table assumes the change lasts a full year and every affected client stays. It also holds payroll, tools, and other spending at their baseline dollar amounts. If you automatically recalculate every expense as a percentage of revenue, you've built a different test and should label it separately.
That distinction matters for sales and marketing. The model has percentage budgets, but a signed program commitment or employee salary doesn't automatically shrink when a seat price falls. Change those expense amounts only when your scenario includes an actual spending decision.
The model's baseline delivery cost also reflects a well-run desk at 0.5 tickets per seat per month. A typical MSP runs 1.0 to 1.4. If your workload differs, rebuild the cost baseline before taking comfort from the modeled margin.
Add the Real Commercial Changes
After the fixed-cost comparison, make a version for the proposed change. Use the agreement dates on which a new rate could start, the clients affected, and any scope changes. An annualized uplift isn't the same as revenue available during the current budget year.
If the price conversation could lead to departures, model the accounts you consider at risk using their actual fees and delivery costs. Show which costs could leave with them and which remain. Removing a client's allocated payroll cost from a spreadsheet isn't a saving if the same salaries are still paid.
For low-margin accounts, inspect the work before treating price as the only answer. The model recommends fixing an environment that drives excess hours before repricing it. Cost the refresh or service change, then check whether the expected workload improvement actually appears.
Don't use the lower-price row as an approved sales offer. The model rejects discounting recurring revenue to win a client. Its usual concession is quoted onboarding waived for a signed agreement, with that unpaid delivery work still planned and costed.
Give the Calculation a Decision to Support
Have finance verify the affected seats, billing dates, and cost assumptions. Have delivery confirm the scope and any proposed workload change. Give the person approving the quote both the fixed-cost result and the version that reflects the actual agreement.
I'd keep the table beside the proposal or renewal decision, with the assumptions dated. It should show the recurring fee, the annual revenue effect, and the earnings left after the costs you will still carry. Approve the price from that calculation, rather than from how small the change looks on a monthly invoice.

mspoutpost.com/articles/test-your-msp-price-per-user-against-annual-ebitda
Written by Graham Whitfield
MSP Outpost publishes information, not legal, financial, insurance, tax or compliance advice, and reading it creates no professional relationship. For decisions about your business, talk to a qualified professional.