
KPIs and Dashboards
Effective hourly rate, gross margin by client, and the dashboard an owner reads on Monday.
- Pick the handful of numbers worth reading every Monday morning.
- Calculate effective hourly rate for each client from your PSA data.
- Lay out one dashboard page an owner can read in five minutes.
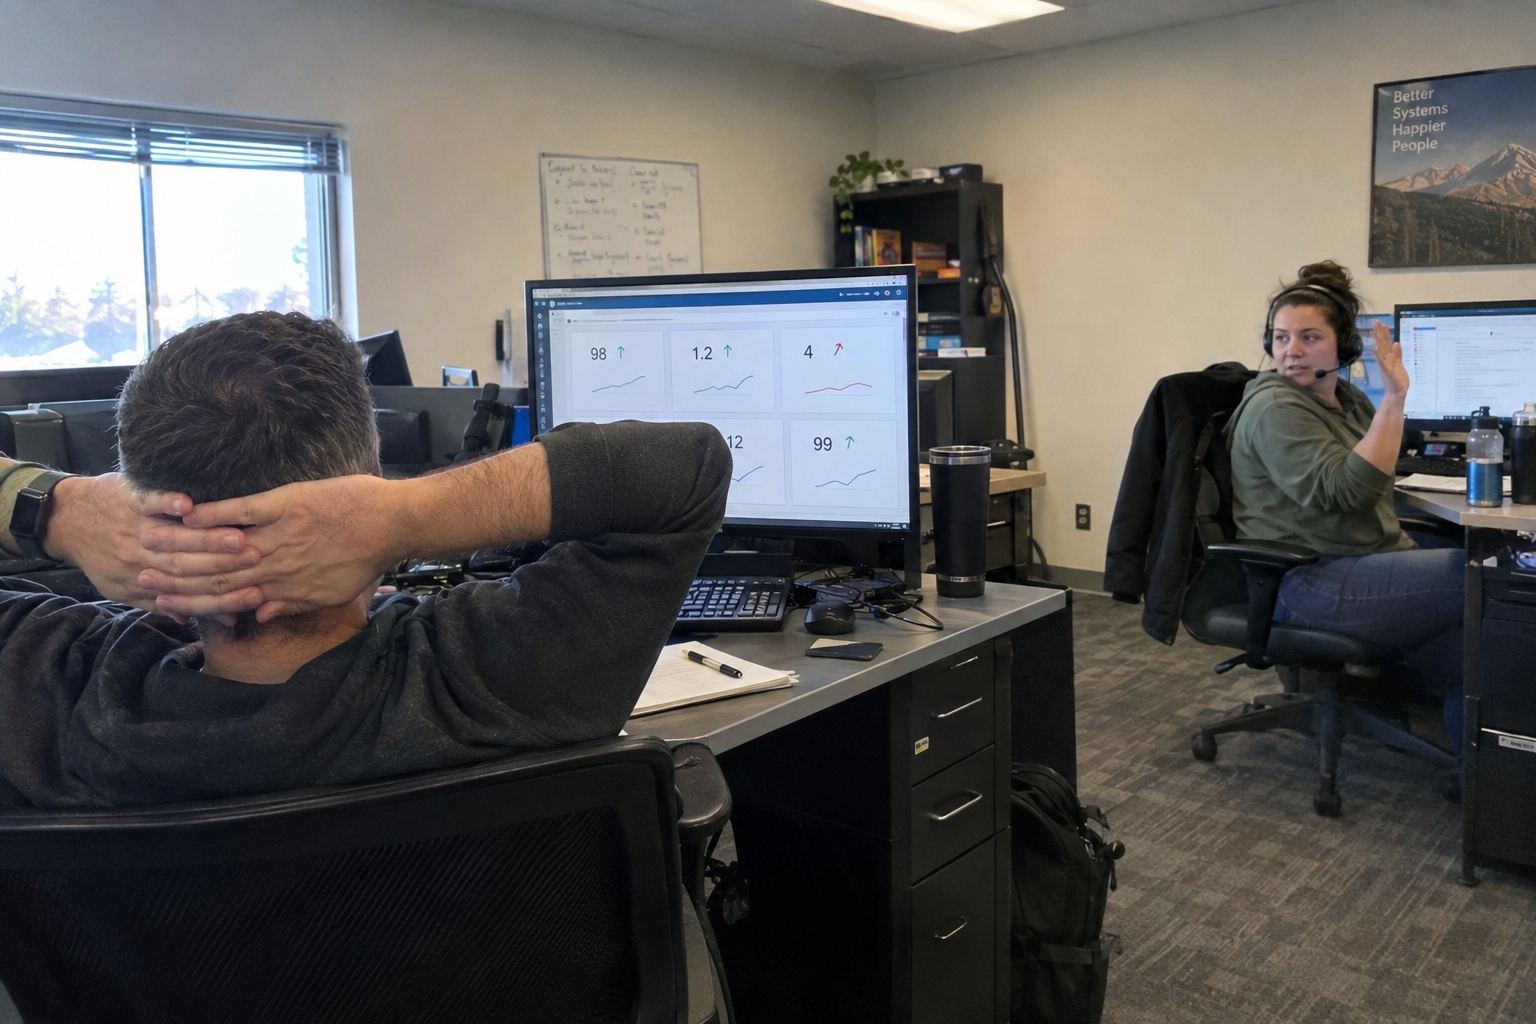
The Five Numbers on Your Monday Dashboard
Monday morning. Your PSA has 47 reports queued, and you know three of them are lying to you. The ticket backlog chart says everything is fine.
Read the Article